
|
|
|
Volume Four - Analyze Your Evidence ( Separating The Good from the Bad )
Now that you have used all your equipment properly and obtained reliable evidence to the best of your ability, it's time to sort through it and determine what it all means. What did you get? Is it paranormal or something explainable? Volume 4 will look at some of the ways people are misled and some of the ways the mind can be fooled by even the best evidence. It's more common than many think! We start with a look at our digital camera and the data it provides that will help us determine what we took a picture of. We will explain orbs and why they are nothing paranormal. Then an explanation of using auditory feedback in EVP research and what is wrong with that. UFOs will be examined and finally a look at a couple alternative theories to explain ghosts. (Where is the proof that ghosts have anything to do with the dead?) Even dreams will be considered, do they have meaning? And what about Bigfoot? Volume Four is based on science but may tend to debunk a lot of the myths we have come to accept. Sit back and read on. Most importantly, Keep an Open Mind! Volume Four Chapter Index
|


|
|
1 - EXIF Data Explained
Before going on I should point out that while EXIF Data tells much about a digital image , it is not foolproof. But one of the first signs a picture has been altered is a lack of the EXIF data file. If you get a photo for analysis without this data, unless a good explanation can be found, I personally would not waste my time with it. I treat those as an attempt to fool or hoax an image. EXIF data is often destroyed when altering an image and the question arises, why was this picture altered? Plus, there are programs available which allow one to alter EXIF data in order to create a hoax. Consequently EXIF data is not a defining object, but certainly can aid in determining conditions when a picture was made. It is assumed for the purpose of this article that no hoax is intended. Looking At The Data Much emphasis is placed on the EXIF data when evaluating a digital image. But how many really know what is contained and what it means? This synopsis will explain a few of the more important data contained in this file. It is by no means a complete explanation, it only highlights the important aspects as related to evaluating a picture as submitted for consideration. Also be aware that different cameras may provide different data and the terminology may vary. The example shown here was taken from an image I made using a Canon SX100 PowerShot. Yours may differ. 
The above image used as an example is a daytime shot. Refer to the following EXIF Data Table as each line is explained below. The EXIF Data is divided into three main sections. The first, Main Information, is a general summary of the camera itself. The second, Sub Information, breaks this down into more detail. The third section, User comment, relates to how the camera was set up for this particular image. In many cases this data is determined by the user and the settings he applies to the camera. In some tables this is combined with the Sub Information section. Note that some fields are not mentioned . These are generally unimportant for most images, or they may be reserved for data not included in this particular make / model of camera. Original EXIF Data for the above photo ( Note, the above image is reduced for this page and EXIF data is not directly available )
Explanation Of Fields:
Orientation: The orientation of the camera relative to the scene, when the image was captured. Outlines the direction the image was rendered, in this case it was rendered left to right. Not important for doing image analysis X Resolution and Y Resolution: The detail of the image in Dots Per Inch. This picture is 180 DPI. the higher the number the more detailed the image. X and Y represent Horizontal and Vertical. Resolution Unit: The scale the resolution detail was measured, in this case, Inch Date Time: The Date and Time the image was made. This assumes the user has set the date correctly on his camera. (Some don't!) YCbCrPositioning: Generally not too important to analyzing a basic picture unless saturation or intensity is an isue. But to explain, we need to define YCbCr. This is one of two primary color spaces used to represent digital component video (the other is RGB). The difference between YCbCr and RGB is that YCbCr represents color as brightness and two color difference signals, while RGB represents color as red, green and blue. In YCbCr, the Y is the brightness (luma), Cb is blue minus luma (B-Y) and Cr is red minus luma (R-Y). The term Centered as it applies here indicates that the camera used a default setting and no adjustment was made. (Normal Image) EXIFInfoOffset: A value related to the table and related data handling. Not important for analyzing the image itself, only if a question arises related to the data processing and the table would this become an issue. Next under the Heading of Sub Information we have the data related to the image itself. This is the area where most image anomalies can be identified. Conditions related to exposure are detailed here.
FNumber : The setting is the aperture setting of the lens (F-Stop) when the image was made. ISOSpeedRatings : The sensitivity of the CCD imager when the image was made. It is equivalent to the Ag-Hr Filmrate.(ASA) Note: Shutter Speed, F-Stop, and ISO Speed are probably the most important details you need when starting analysis of any image. ExifVersion : The version of EXIF included with this camera. Not important unless an issue arises related to the file itself. DateTimeOriginal and DateTimeDigitized: Normally these two are the same unless a modification was made. It is the Date and Time the image was made and the time it was placed in a digital format. But sometimes if one attempts to alter the image the Digitized Time will show the time the alteration was made. May sometimes help you spot a hoax. CompressedBitsPerPixel : The average compression ratio of the JPG image In this case 3/1 (bit/pixel) ShutterSpeedValue : The actual shutter speed of the camera used. Generally the same as exposure time although some cameras may use a digital value which must be converted to actual seconds. ApertureValue : The actual aperture used to make the image. Should be the same as the FNumber although some cameras may use a digital value which must be converted to the actual F-Stop. MaxApertureValue : The maximum aperture setting the camera is capable of using, not necessarily the same as that used in the image. MeteringMode :The method used by the camera to determine settings. (Center, Multispot, Spot, etc.) Flash : Whether or not the flash fired. Compulsory means the camera was configured to flash or not flash regardless of light conditions. FocalLength : Focal length of lens in millimeters. In this case it was 6.00(mm) MakerNote : Internal data used by manufacturer. Not important for analyzing image. Finally under the User Comment Section we find additional information related to the image. Some manufacturers include this data under the Sub Information heading. ExifImageWidth and ExifImageHeight : This is the full size of the main image in pixels. FocalPlaneXResolution and FocalPlaneYResolution :Pixel density of the CCD imager in the camera. Generally not important for analysis of image although a higher density results in a sharper image. Determined by the camera itself. FocalPlaneResolutionUnit : Unit of measure which determined the FocalPlaneResolution. ExposureMode : Program used to make image, in this case "Auto" means camera was used in automatic as opposed to aperture priority, shutter priority, etc. These settings were determined by the user at the time the picture was made. DigitalZoomRatio : If digital zoom was used this would indicate the ratio of digital to optical zoom. This image ratio is 3264/3264. Since both numbers (pixels) are the same no digital zoom was used. The Vendor Original Information provides additional data unique to individual manufacturers. Your camera may provide additional data not covered here, or its terminology may differ. MacroMode : If the camera has the ability to do Macro images this will give its status. In this case it was Off Self-timer : The Self Timer was not used for this image. Quality :If the camera has multiple quality settings this field will show which was used for the picture. In this case "Fine" was selected. FlashMode : The status of the flash. In this case it was forced off, likely because the image was made in daylight and the flash was not raised. Easy shooting mode : Like many digital cameras, this camera has multiple modes, Daytime, Night, Cloudy, Sunny, etc. In this case instead this image was made in the Full Auto Mode which allowed the camera to pick the optimum settings. Digital Zoom : Status of the Digital Zoom. In this case it was turned Off FocusType :Type of Focus. This image was made using the Auto Focus feature of the camera. ExposureProgram : (See Easy Shooting above.) Easy Shooting is the terminology for the "Point and Shoot" option with this camera. Focal length of lens : The range of the Optical Zoom feature of this camera. 6-60(mm) Long Shutter Mode : This indicates the "Bulb" setting was not used. "Bulb" is the old terminology for holding the shutter open the entire time the shutter button is depressed allowing for extremely long exposure times. There are additional factors available but they are generally not needed to do an analysis of most images. Your camera may have additional data not included here. You can do a search for this on the manufacturer's website or other reference sites. Hopefully this will give the reader an idea why the EXIF data is so important and why I will not do any analysis unless it is available. |
||

|
|
2 - The Effect Of Image Compression On Your Pictures We see pictures pasted all over the internet in various formats, most are lossy. But just how much can this affect what we see? Let's take a look at the most common format, the "JPG" Image. What is illustrated here is a simplified version of what can become a very complex issue. You can clearly see how colors are altered and pixels changed when a digital picture is processed. To illustrate this take a look at Figure 1 below. It shows a three colored image, Dark Green, Red and Black. (Disregard the yellow box for now; it simply shows the central portion we will be explaining shortly.) There are only three colors present. The pixels in those colors are weighted as follows, Green="008000", Red="FF0000", and Black="000000". Every pixel in this figure is one of those three values. Next, the center section in the yellow box was copied and converted to a compressed JPG format. This was enlarged and shown as Figure 2. Note how the pixels near any edge has many color intensities present. These colors are false, they do not exist in the original image. They are artifacts created by the conversion process. The edges of the black line also have a fuzzy grey boundary, not the clear solid black of the original. Some of these false colors are close to the original and difficult to see, but others are clearly visible. 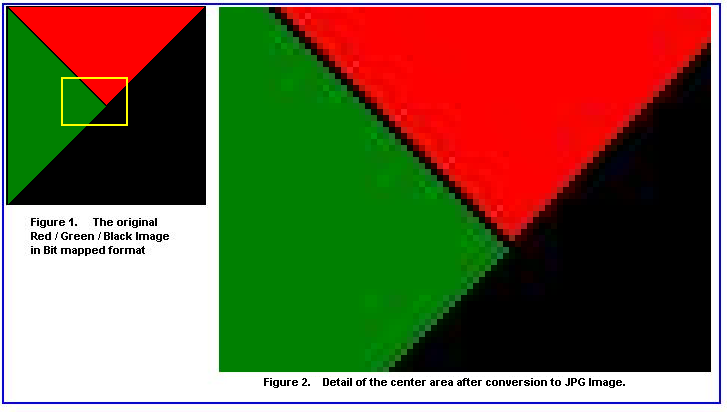 Now for a better look at how significant this is, Figure 3 below shows a small section of Figure 2 along the line between the Red / Green boundary. You can see the multiple intensities of pixels that have been created. Finally in Figure 4 we have taken Figure 1, enlarged it for clarity, and changed only those pixels which are unaltered to Blue. What remains demonstrates just how significant the change was to the original image and how much damage was done to its value as evidence. Any area not blue is false, altered from the original. 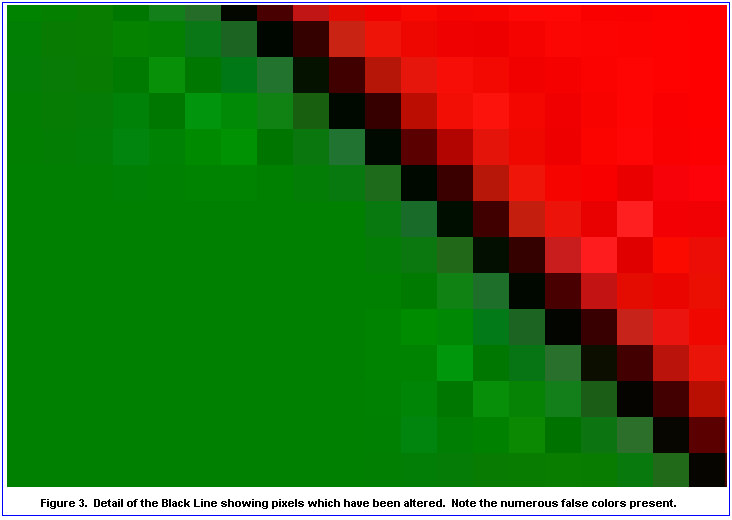 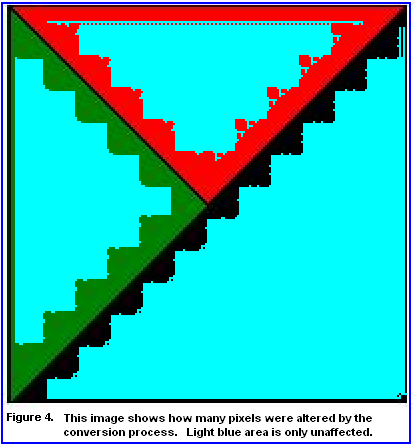 I should also emphasize this is a simplified example. Here, only three distinct colors were present in the original. In real life a picture will contain hundreds if not thousands of individual colors that comprise the image. Each of these would have an area around them similar to the ones shown in the example. Thus the number of possible errors will also be much greater as there are many more conversions done to compress the image. Likely the entire image would have false colors over large parts of it. One more point needs made. The trend toward using phone cameras contributes to poor quality images. JPG images can use different compression values. For this article I used an average value. in order to save memory some phones use even higher compression factors which would extend the altered areas further into the image due to more altered pixel values. Another reason to not use phone cameras for evidence gathering. A final note for any who wish to play with the examples presented here. If you view Figure 1 and enlarge it you may be inclined to question my claim of only three colors present, and you would be right. The posting of the figures on this and any website also creates errors. The original of the figures used here were created using the non-lossy Bit Mapped Format directly on the computer, not from a camera. This assured a non-compressed original and that no errors were present before the conversion process was done.. But websites require the use of jpg or similar formats which as explained, are lossy. Thus there are errors present even here. But the examples shown are still valid, they show errors actually captured using Bit Mapping and screen capture methods, which preserve the errors, not simply enlarging the image as you did on your computer. |
|
|
3 - Lens Flare and Its Effects On Pictures Next to Pareidolia, Lens Flare is the most common anomaly seen in pictures claimed to be paranormal. It is also one of the easiest to account for and prevent. But what is lens flare? What causes it? Lens flare is a reflection of light on the surface of a lens. Any smooth surface of glass is reflective. But that characteristic also occurs on the inside surface as well as the outside. Figure 5 shows a drawing of a simple convex lens. The camera is focused on the subject, a tree, with the sun in the background shining into the lens. The path of light shown by the blue lines indicate how the reflected light from the tree strikes the film or imager in the back of the camera. It is upside down because of the inversion of the image as the lens passes it through the focal point. The sun would appear in this picture at the top of the tree just as it actually was at the time. But there is something else going on here as well. The sun is so bright that a portion of its light is also being reflected from the inside of the lens surface back toward the front of the camera. It will be reflected a second time by the inside surface of the front of the lens. Its path of light is shown by the red line. Note that it passes through the back of the lens and also strikes the film or imager. This path of light strikes the inverted image of the tree near the ground in the image. This is why lens flare is opposite the position of the source in the image. If you tilt the camera up, the reflection will appear lower in the picture. Lower the camera and the reflection will raise. That is a characteristic of lens flare, the reflection moves opposite direction you point the camera. I should also point out that this effect also applies to video cameras. But since video involves movement the lens flare can appear as a bright object actually moving through the field of view. A bright spot moving through the air can easily be construed to be a UFO. And they have at times. 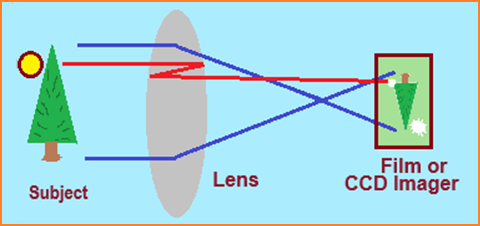 Often someone asks you about a spot on their picture and many think it is paranormal. You can test the claim by making two copies of the picture on your computer. Next take on copy and rotate it 180 degrees, then overlay the two images. If it is lens flare the spot will fall directly over the source of the light causing it. Of course that only works if the pictures are not altered or cropped in any way. One more condition needs mentioned. Sometimes the source of the flare is outside the field of view. Often you can get a clue if that is the case by observing any shadows in the picture. If all the shadows are coming somewhat toward the camera that is a good sign sunlight may have been hitting the lens even though it's not visible in the picture. The nature of lens flare allows for reflection from any direct light hitting the surface of the lens even if it is somewhat out of the field of view. So what can be done about lens flare? The easiest way to prevent it is be careful when taking the picture. Never point the camera toward any bright light source. If conditions are such you can't avoid it, then use a lens hood which will shield the lens against off axis light sources. The camera itself may be a factor as well. We have been seeing the results of a single convex lens like that used in most low cost or phone cameras. If your picture is taken through a multi-element lens things change considerably. These lenses used on SLR cameras often use a combination of convex and concave lenses designed to minimize internal reflections. In addition they may be coated which also reduces that potential. While you may still experience lens flare it is much less common with these cameras. Often flare is spread out across the picture and much less intense. Instead of getting flare and trying to deal with it, you may have to actually work at obtaining flare if that is your intent. (Sometimes photographers actually want flare to add to the effects they want create!) |
|
|
4 - What About Orbs? - Orbs Exist And I Can Prove It !
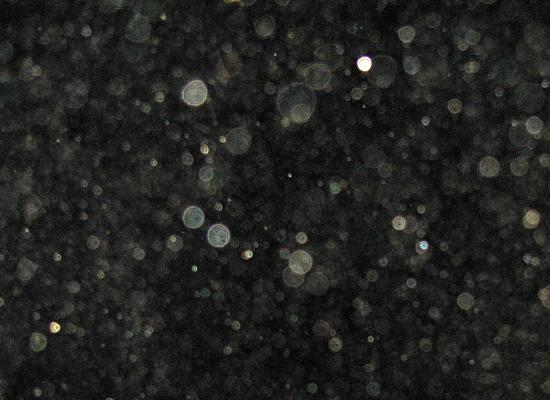
This subject is constantly being discussed and rehashed. Paranormal orbs of light or energy keep surfacing on websites as proof of spirits. And the skeptics keep debunking them as dust. I also keep getting them submitted as evidence, and I keep debunking them as well. As a result I have written this essay that will not only debunk them but give the evidence serious researchers need to put this topic to bed once and for all. So, for one final time, "What are Orbs?" Orbs - The Final Word
They are "Dust!" But let's clarify, I am using the term dust in this essay to cover all particulate matter. If one wishes to debate dust versus pollen versus water vapor this report will touch on a few basics but won't go into great detail. That is the subject for another article! But, you ask, Are there any orbs that are not dust? To answer that I will say yes, but they are rare and not what is generally seen in photos. Energy forms such as a plasma or ball lightning may appear as an orb. But if you capture those on a photo the conditions are drastically different than the typical night time orb photo. Either of those would be self illuminating and would appear without the use of flash even in total darkness. So for now we'll leave those out of the discussion and come back to them later. Thus we can make a blanket statement here regarding how to tell a "real" orb.
Typical dust orbs are passive, that is they do not shine of their own accord; they reflect back the light from a flash or other light source. Refer to Figure 2A below as I explain how dust appears as an orb in a picture. Note the location of the dust orb It is far too close the camera for it to be properly focused. Plus, it is very near the camera flash and will receive a very intense flash when the picture is made. So even though it is small it will catch a lot of light and reflect brightly. The next concern is the size of the orb. Dust is generally very small, on the order of a few microns, so something else must account for the wide variation in the size of orbs. The answer is the distance from the camera. Just as your finger appears much larger when held closer to your eye the dust particle appears larger as it gets closer the camera lens. The actual sizes of dust particles are actually quite similar. While some variations do occur, most common dust is less than 50 microns in size. Larger particles tend to fall out of the air rather quickly. One may be tempted to think that the size of the particle will determine its size in the picture. That is not the case due to the depth of field errors and the inability of the camera to properly focus on this point. The apparent size is much greater, often by a factor of several thousand, than the actual size of the particle. But another interesting characteristic relates to the orb's apparent brightness. Even though it gets closer the camera and should reflect more light, it doesn't become much brighter. That is because the total amount of light reflected is spread out over a larger area of the picture. Intensity changes little but the area covered by the orb in the photo goes up considerably as the dust particle gets closer to the camera. So a statement can be made:
Another factor present when comparing orbs is luminosity, or how bright it appears. This is determined by its composition. Some materials reflect light better than others. Thus two orbs, assuming both appear about the same size in a picture, can differ in intensity based on how well each reflects the light of the flash. Some dust particles are rather dark in color while water vapor may be quite bright. Thus a water vapor droplet may appear much brighter than a similar dust particle. This is especially true of pollen, different varieties are quite different in their light reflecting properties. Related to luminosity is color. Obviously different compositions of matter may differ in color, therefore the color of an orb is also based on its composition. In the case of water vapor the clear nature of the particle may separate the color spectrum much as a prism does. This can also affect the apparent color of the orb.
One more important fact needs pointed out here before we go on. Pictures are two dimensional in nature. They can show us height and width, but unless you are using a special 3D camera cannot directly display depth. By the way, as a side comment here, the dual lens of a 3D camera system is immune to dust orbs since it is impossible for a single dust orb to be in the same "sweet spot" of two lenses at the same time! It's Something to consider if you are doing paranormal photos! 
Figure 2 Compare the two illustrations above. Figure 2A shows the dust orb we have been discussing and the light path which illuminates it. Note it is near the camera, inside the camera's depth of field. Thus it appears out of focus and orb-like in appearance. This is the "sweet spot", the point where the dust particle is close enough to be well inside the camera's depth of field and also be illuminated and photographed at the same time. This set up will create the typical orb photo. Now consider how the 2 dimensional limitation affects the picture. Most pictures focus on a subject about 6 to 12 feet from the camera. Most of us expect our picture to focus on that area. Again consider Figure 2A. The dust orb appears in the picture and is located above the subject's head in the finished picture. Its luminosity is about that of the subject, and the well defined edges of the orb defines it as near the subject. The viewer is tricked into thinking the orb is a baseball sized orb floating directly over the subject. And when this happens the believers in orbs run off saying they just caught a paranormal orb floating above our hapless subject! Not so fast here! Look at Figure 2B. This is the configuration the way the believer sees it. Consider, the flash put out a fixed amount of light across the entire field of view when it fired. (Red Outline) It lit the subject, the wall behind him, and our orb as well. Let's assume 50% of the light which struck the orb was reflected back to the camera. That is the amount which would be required to illuminate an object or orb at that point in the picture to the level most consider orbs to be. It would show as a semi-transparent object lit to about the same intensity as the subject. But something else even more important needs pointed out. Since the flash was uniform, a fixed amount of light was generated. If 50% of that was returned by the orb, only the remaining 50% could pass through the orb and illuminate the wall. This reduction would show as a shadow on the wall as seen here. When you view the picture you will see a shadow with one exception. That exception is the orb wasn't really there. This is the way a true orb versus a dust particle can be identified. Look for the shadow. If it's there, you have a paranormal orb. If not, you have dust. Now back to those Active Orbs. I put that off till now simply because they are very rare. Possibly the reason is most people don't take pictures in a manner which they would appear. Consider, active orbs are those which shine on their own accord. They are self illuminating. As such, they will show up in a picture with no flash used, they will illuminate the scene. They will cause other objects in the picture to cast shadows on the scene. Consider them much as you would a light bulb hanging in the picture illuminating the field of view. The bulb, not your flash, will provide the light for your picture. You can take advantage of this as well. Since you are wanting to capture active orbs, simply set up your camera on a tripod in a totally dark room. Set your shutter speed to its "bulb" or open position and open the shutter for a period of minutes to hours. If no lights are turned on you will get a totally dark picture. If an active orb just happens by its light will expose the frame for you. Since dust doesn't shine on its own, dust orbs are not the issue here. There is one more situation where an active orb might creep into your picture that needs mentioning. If you take a close-up picture at night there is a possibility that a distant light source may appear as an orb. The reason is that in the close-up the camera focuses on the subject placing everything behind it beyond the depth of field. If some other pin point of light is in the background it will appear much like the dust orbs mentioned earlier. The limited amount of light available though likely will prevent any visible shadow from being cast by the foreground objects. So before thinking you caught an active orb recheck the scene in daytime or take a second picture of the same scene to rule out the distant light source issue.
That is a case of pareidolia coupled with how our brains are wired. one of our basic instincts and that of most animals is the "Friend or Foe" conditioning. What do you see in the simple picture below? 
Figure 3 If you are like most people you see a face, two eyes and a nose or mouth. It is an example of how our brains assign a face to any pattern that even remotely resembles that configuration. We do this because our ancestor's survival depended on identifying other people who they came in contact with. Friend or foe? Mis-identify and it could result in one's death from an enemy. So even today we apply this reasoning when we encounter something that even remotely could resemble another human face. (By the way, "Face" outnumbers the second most common identification by almost 2 to 1, the second being Bowling Ball.) This description is made even though the figure completely lacks ears, hair, or a nose! It's amazing just how many details pareidolia can supply. So what really causes the patterns in a dust orb? Up until now we assumed our dust orb to be a simple undefined speck. In reality they are an irregular shape. If we examined one under a microscope would see parts which reflect better than others. We might also see the particle is actually like a short string or fiber instead of a speck. If we were to examine how the light reflects from various parts of the dust particle we would see points where the light is added and subtracted from the total amount. Then the depth of field error would blend this into random patterns of lighter and darker sections confined to the overall area where the orb is seen. And if any three of these light or dark areas just happen to form a "face", then the orb has one too. Refer back to Figure 3! Chromatic Aberration is another cause for patterns in orbs. To explain, In optics, this is a type of distortion in which there is a failure of a lens to focus all colors to the same convergence point. It occurs because lenses have a different refractive index for different wavelengths of light (colors). With regards to orbs, because they are already outside the camera's depth of field, this problem is made worse. Standing waves are created as the light interacts inside the lens. And just as noted previously these add and subtract causing patterns of color. They add another level of ambiguity to the orb. Or maybe make the face even more pronounced! And Finally... What about orbs with tails? As with most still photography tails are the result of motion blur. Consider, even if you use a tripod and the rest of the picture is clear, an orb can move past the camera just as you make your picture. Of course for those who believe the orb is over the subject's head considerable movement would be needed to explain the length of the tail often seen. But we are dealing with a dust particle inches from the camera. At this close range only a fraction of an inch of movement by the dust particle is needed. The next time you have sunlight coming in through a window, stop and look at the dust particles floating in the air. Have you ever seen one NOT in motion? Hopefully this article will explain orb photos and in so doing will help get some of this bad evidence out of circulation. The paranormal field has enough to do without trying to justify those who attribute paranormal abilities and claims to common household dust.
| |
|
|
5 - Analyzing Audio - EVP and AVP Recordings A few years ago orbs were considered paranormal. But now, even the most ardent believers have to admit that dust can cause orbs in pictures. We can prove dust is responsible; anyone can do the experiment outlined previously and observe for themselves. But EVP has yet to be given the same level of analysis. Many people still bring in recordings that are questionable at best claiming they are proof of spirit communication. Those of us who do analysis use methods which serve to debunk most EVP; perhaps if others applied the same critical analysis instead of just assuming something is communicating we could improve the quality of evidence available for study. This essay will outline the basic methods I use when I receive an EVP recording. To begin with, any evidence requires a summary of how it was obtained. This includes the make, model, and the settings of any equipment used in obtaining it. One should also provide any environmental records that may have influenced the recording process. While these may not directly influence what is on the recording, they could sway one's opinion of subjective matter. For that reason alone they become a part of the evidence process. And of course knowing if anyone was present in the room at the time the recording was made is helpful in eliminating that source of contamination. STEP 1 Let's take a hypothetical EVP through the process, step by step. that I would do. Of course this method may be altered if the evidence warrants, this is a basic outline only. The first thing is to rule out the most common form of false positive, pareidolia. This is done using the Rule of Three.
Consider, if someone speaks directly to a group of people there is usually little discrepancy in what was said. But if the message is garbled it becomes somewhat subjective in content. The more garbled it becomes, the more subjective. Eventually it reaches a point where no one can understand it and subjectivity / pareidolia takes over. The Rule Of three simply establishes the point where this transition takes place. As such it also determines when an EVP no longer remains credible. STEP 2 But for sake of discussion we will assume this EVP passes the Rule Of Three review. The next step is to determine its source; background sounds, recording artifact, or something else. For that we need the buffer area before and after the EVP. I always want a minute or so of recording before and after the EVP along with the actual EVP. Any physical sounds in the room will leave a certain ambiance related to the room. This is compared to that which accompanies the EVP. In the process you may hear something which matches phonemes related to the EVP. All electronics introduces certain sounds. The background hiss is one example. This becomes a subtle part of any recording we must deal with. And we can't forget about the location itself. Buildings creak, an animal may call out in the distance, traffic may go by outside, including someone with a loud radio playing. All of these contribute their own unique sounds to the background. Then there are the Sounds like that of a freezer compressor for example may mimic a pulsating sound of a "P" for example. Alone it is clearly a freezer but if some other sound occurs at the same time two may blend into something like a word. This can be confusing and lead one to think they caught something when in fact the environment was responsible. Or listen for the sound of traffic outside. If a car drives past you now have that sound to compare with anything else on the recording as a reference. Which also may be something to consider if you hear voices just as the car passes. Might the driver had that radio blaring? So listen to each sound individually. Note the ambiance of each. Does one sound different than the other? Does part of a word sound like it was close by while the next phoneme sound distant? That is a clear indication the word was not formed as an EVP; rather a combination of two sounds occurring in succession. Remember, the portion of the recording before and after the EVP is just as important as the EVP itself. STEP 3 What about the content of the EVP itself? What if it answered a question I asked? That is really not always significant unless you asked the right question. If the investigator asked a "Yes-No" question, the EVP answering "Yes" or "No" is no more evidence than saying "Knock once for yes, twice for no", and getting the sound of a rafter creaking. The single word answer is meaningless. Why? Go back to Step 2 and consider all the sounds you may pick up. Then consider that much speech can be done using only 25 phonemes. How hard would it be for two or three sounds to fall together in a manner to form a simple, short word? Also consider, there may be no correct answer. So even if you got a "Yes" or "no" would you know which is correct? The solution here is length of the message. If you ask questions that require some degree of response, several words for example, and get a sentence in response we can rule out many random sounds that might occur while the recording was being made. Rafters creak once, maybe twice in succession, not 15 or 20 times. Also, those short responses are much easier duplicated by background sounds. Consider the electronics hiss mentioned earlier. You already have 1/3 of the phonemes required to form the word "Yes" present. Anything making a rubbing sound can sound like an "eeh" phoneme. Put the "eeh" in front of the "SS" electronic hiss and you have an "es" sound. Now ask a question requiring a "yes-No" answer and you get "es". Auditory pareidolia will supply the missing "Y" sound and you have the making of a false positive. To summarize these three steps we see the importance of minimizing extraneous noise since that leads to pareidolia and has nothing to do with "helping" any spirit communicate. It also shoots a hole in the common belief that one should create background sound such as white noise or other contamination. Sure, it helps get more recordings but they are also false positives. This also points out the importance of using quality recording equipment. (That is covered elsewhere!) Cheap voice recorders by nature create artifacts which manifest themselves as noise. This also contributes to false positives, thus the reasoning some claim that using cheap recorders gets more EVP. Assuming diligence was used in obtaining your EVP, and quality equipment in recording it, using the above methods will eliminate a large part of what you do capture. And it will also leave fewer, but much more credible, recordings that might be EVP. STEP 4 Once you get through the initial steps you will find that about 5% of your recordings seem to be valid. Now this doesn't make them so, but you certainly want to test them to the fullest extent possible to make sure. There is no short cut or cheap way past this; if you get an EVP to this level and you lack the equipment to do a complete analysis you may want to submit it to someone who can put through the tests. ( I require any submitted recording I process pass a Rule Of Three evaluation prior to submission simply because I don't have time to waste on obvious cases of pareidolia.) But I will outline a bit of what is done when a recording is accepted so you can get an idea of the methodology applied. This is the most complex area and I can only touch on a few points here. It would require more than I am going to outline here to cover all the methods and what may be done to enhance and further define an EVP. But for sake of discussion we will assume your recording requires in depth analysis. It has already passed the first three criteria outlined above. Now I am going to dig deeper into it. The first thing will be to run it through a spectrum analyzer. This will display all the frequencies present in the recording. Some may be voice, others may be extraneous noise. The spectrum analyzer will show all, and a comparison against the real time recording allows the source to be identified. The next step requires the use of narrow band filtering. The EVP is played through the filters, then, using the frequencies obtained from the spectrum analyzer, one by one these are omitted then restored while both observing the EVP on an oscilloscope and listening to it. The EVP may be called into question if its content changes when a frequency related to background noise is removed. That raises the possibility that the noise contributed to the recording, not actual communication. Of course the filtering may reveal nothing, the recording may not have any matches between the background frequencies and voice patterns. The next step is to observe individual phonemes on the oscilloscope. These are compared to known speech patterns. For example, a spoken "sss" sound has a certain wave form that differs from the "SSS" created by electronic noise. The reason is the source of each. The spoken sound is modeled by the human vocal tract (notably the tongue and teeth in this case while the electronic sound is created by the flow of electrons through a circuit. These create radically different patterns although the sounds may be similar. Earlier the sound of a "P" was mentioned as possibly coming from the compressor in a refrigerator or freezer. If such a sound is displayed on a scope, its nature is very apparent. Motors and such make a sort of rumble that has a slow rise time. The "P" sound made by the mouth is much faster. The explosive puff of air is easily displayed as such on the oscilloscope. This rise time is easily seen on a scope at the start of the phoneme in question. Another thing to observe is the rise, blend, and decay of each phoneme. Human speech has a tendency to blend sounds together. One phoneme often blends into the next. Mechanical noise is usually more isolated with each sound ending as the next begins. This is seen when a waveform is displayed on the oscilloscope. You may notice a lot of evaluation is made visually on a scope rather than just listening to it. There is a very good reason for that fact. Oscilloscopes do not experience pareidolia; they simply display the signal as it is. And the eyes of the technician are not subject to auditory pareidolia. Thus a thorough analysis can virtually eliminate pareidolia from our recording. Each phoneme of speech has its own unique characteristics. And each must be taken apart and examined one at a time. Sometimes this is aided by using band pass filtering; other times it's not needed. The point is this becomes a time consuming process, and no single method can be set. Each step along the way is determined by earlier tests on the recording. Some phonemes may match speech patterns, others may not be as definitive. Sometimes a single evaluation reveals the truth, other times several tests and attempts may be needed to determine the nature of a particular sound. In the end you will have to evaluate the recording noting how many match versus those that don't. One or two mismatches generally doesn't mean much. But if half or more don't follow speech patterns doubts begin to surface as to the validity of the recording. Too many doubts means you may have to discount the recording after all. To summarize, using a complex analysis method like this is preferred over any software based program. Software applies alterations to the recording then mathematically alters the data stream before playing it back. The integrity of the original audio may be lost. And if these alterations cause a false positive you end up calling something created by the software valid. The analog methods I outline above in no way alter the actual audio, they simply enhance what is already there by removing the undesirable aspects of the recording. But to do it right, that is the way to process audio. |
|
|
6 - Regarding ITC - An Explanation of Why Using Feedback Is A Bad Idea Instrumental TransCommunication by nature seeks to establish some form of contact, often in real time, with a spirit or other entity. In that regard the concept is worthy of continued research. Some include EVP research into the ITC field among other more exotic methods as well. For purpose of this discussion I am going to consider those methods which involve some form of feedback loop. It is not the intent of this discussion to negate all ITC or EVP work. Rather it is to define why the popular idea of creating a feedback loop to achieve these ends is unwise and in fact a detrimental concept to your goals. To understand how ITC in a feedback mode operates you also need to have a basic understanding of the electronic equipment used in such an endeavor. All signals, either audio or visual as we see them or hear them are of an analog nature. They may vary in intensity or frequency, but they still must be considered linear. For example a light may be dim or bright, and may be somewhere in between in intensity. This would be a definition of a linear signal. Electronics such as video cameras, must operate within this range of intensity to properly display an image. These devices use class A linear amplifiers. A simplified example of how such an amplifier works is shown in the graphs below. The curve represents the response of a linear class A amplifier. You will note that at either end of the curve the amplifier deviates from the linear response. These areas are known as cutoff (low levels) and saturation (high levels). All linear amplifiers exhibit this characteristic; there is a point where no current flows (cutoff) and a point where current flow reaches a maximum limit and can go no higher (saturation).  Figure 1A represents an ideal situation, you can see from the voltage (input signal level) at the bottom a low signal level is amplified and the corresponding output voltage is shown on the right. Since the amplifier has a gain of 5, it is clear that a 2 volt peak to peak sine wave input results in a 10 volt sine wave peak to peak output. There is little distortion because the entire operation remains within the linear portion of the response curve.  But what happens if we overdrive the amplifier, using an input signal of 5 volts or more? Figure 1B represents how this same amplifier would react under such a condition. The input is well above and below the linear region. The amplifier is driven into cutoff on the low side and saturation on the high side. Notice how any signal deviation that might take place near either cutoff and saturation is lost. Under these conditions the amplifier becomes unstable, and any small signals which might contain information are lost. When one puts an amplifier in a feedback mode, it quickly reaches a point where it has entered an overdriven state. If we start with a signal of 1/10 Volt and amplify it using this example (gain of 5) it results in a 1/2 volt output. This is within acceptable limits. But because it is configured in a feedback loop that 1/2 volt output wraps around and becomes the input. Now with 1/2 volt of input it generates 2 volts of output. Still acceptable, and again it feeds back on itself. we have a situation seen it Figure 1A. Acceptable, but one can see where this is going. We have all heard a microphone squeal on a PA system. It starts quietly then continually builds to a deafening howl. Now look at Figure 1B and we can see where continued feedback drives the amplifier into distortion. This is unacceptable, severe clipping will take place, and the output becomes unstable. This is exactly what happens when an ITC experiment uses a feedback loop. But How Does This Affect ITC? If we consider the level of most alleged contact we can see it generally is of a low amplitude. EVPs are generally low volume; Ghost images when they appear are generally very dark; video is as a rule faint impressions. Seldom does anyone get anything that is in-your-face clear. Signal levels are as a rule very low. If you look at Figure 2A below, you can see how such a low level signal might be passed through an amplifier. It could be either an audio or a video signal, the important thing is that it must be amplified, yet reproduced accurately. Compare this to Figure 1A above, and you can see how the distortion is kept to a minimum as the signal is amplified. one can easily see how this is maintained as some waves are higher than others, yet the output is a faithful reproduction of the input. Those with higher amplitude follow the same order input to output.  Now let's assume a feedback situation is created. The signal is still present, however it is riding on top of a very large signal created by the feedback loop. (Note the regions highlighted in yellow.)  The desired, let's assume the ghost generated, signal you seek is seen here along with the much larger feedback generated signal. It is exceeding both cutoff and saturation points of the amplifier. Note what happens. Since the amplifier is being overdriven the desired signal is lost. Thus, not only are we unable to amplify such a weak signal under these conditions, what little is present is removed in the process! Your ghost, if it exists at all, is completely unable to communicate with you. Feedback methods such as these actually are a sure way to not succeed at communication. So what constitutes a feedback loop? Any closed loop where energy is received and placed back into the loop to be re-processed again is a feedback loop. Placing a microphone in front of a speaker is a feedback loop. Using a camera to take an image of a monitor to which it is connected is a feedback loop. The important aspect though is how the devices are connected. The output must be fed back to the input to be considered a feedback loop. Simply placing a camera in front of a monitor showing some other image is not feedback. Only if that camera is feeding the image to that stated monitor or TV is it considered feedback. The same logic applies whether it is a video feedback or audio feedback loop. Non-linear operation results in unreliable and unstable signals. These become very easy for anyone to read in whatever they want to the output. Consider the audio equivalent, if you had a PA system where the microphone was too close the speaker and it starts squealing. Now if you turn down the gain it generally quits and things work fine. But consider how hard it would be to hear the speaker if he simply talked with this squeal building up to maximum intensity. Or to put it another way, suppose you are in a brightly lighted room. The intensity of the light represents the saturation level created by a feedback loop with the ability of the electronics at its limit. Now you light a candle. The candle represents the message from the spirit. How much difference is the candle going to make in the light level of the room? Amplifiers can react in other ways too when they operate in a non-linear mode. One such condition results if the signal shifts more into either cutoff or saturation than it does in the opposite direction. This can make the amplifier respond as an RF detector. When this happens it can actually receive radio broadcasts and convert them to audio. It is plain to see how under these conditions the radio broadcasts can be mistaken for voices from the spirits! As stated at the outset it was not the intent of this article to either validate nor condemn all ITC or EVP research. Rather it was to point out how a popular method used is flawed. Hopefully those researchers involved in this area will consider the known laws regarding how electronics operates and accept these constraints before going out and using methods which clearly violate the laws which govern electronics and physics. Finally, one more consideration must be made. When it comes to audio, noise such as this contribute a "seed" to encourage pareidolia.
This makes Pareidolia another source of a false positives in EVP work. That is why some people make claims of hearing voices when the feedback begins. Consider that fact before creating feedback or noise of any kind when doing audio work of any kind. Likewise video pareidolia is responsible for the "faces" or other such forms seen in the random noise on a video screen which is dealing with a saturation condition. When dealing with a low level signal condition uncontrolled positive feedback of any kind is never a good thing! |